
Introduction:
This guide explains how to compile all of your leads’ results and display them in one chart using LeadsHook.
Step by Step Instructions
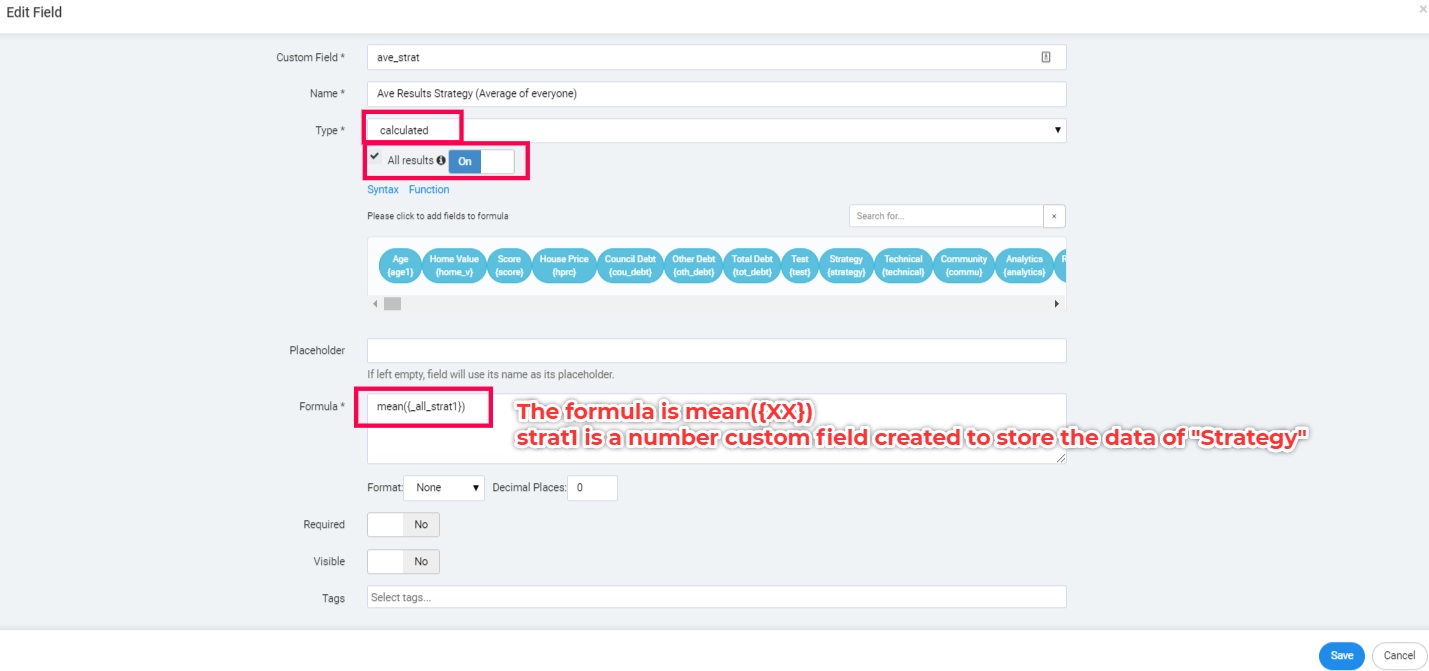
1. Create calculated custom fields to calculate the average of each data.
Based on the above examples, we will create 5 calculated custom fields to calculate the average of each data:
- Strategy
- Technical
- Community
- Analytics
- Revenue Potential
Note: Strategy, Technical, Community, Analytics and Revenue Potential data are stored in number custom fields.
Here is the configuration of a calculated custom field for “Strategy”
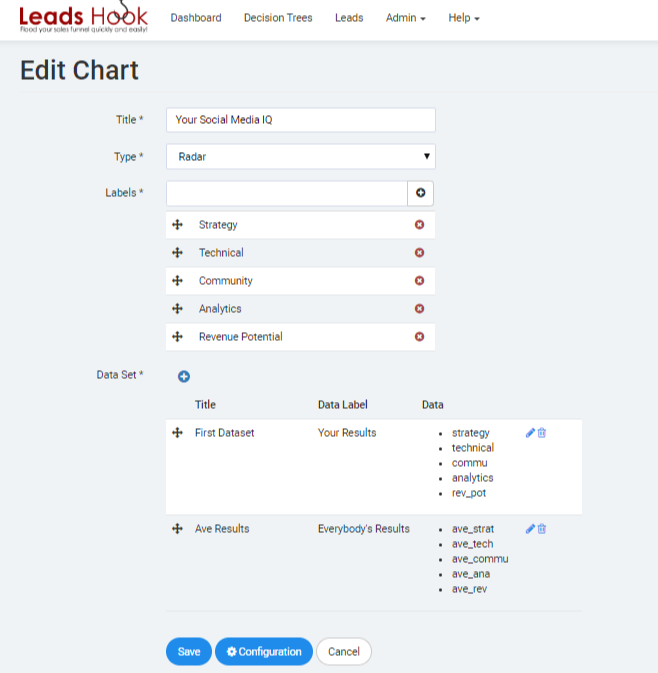
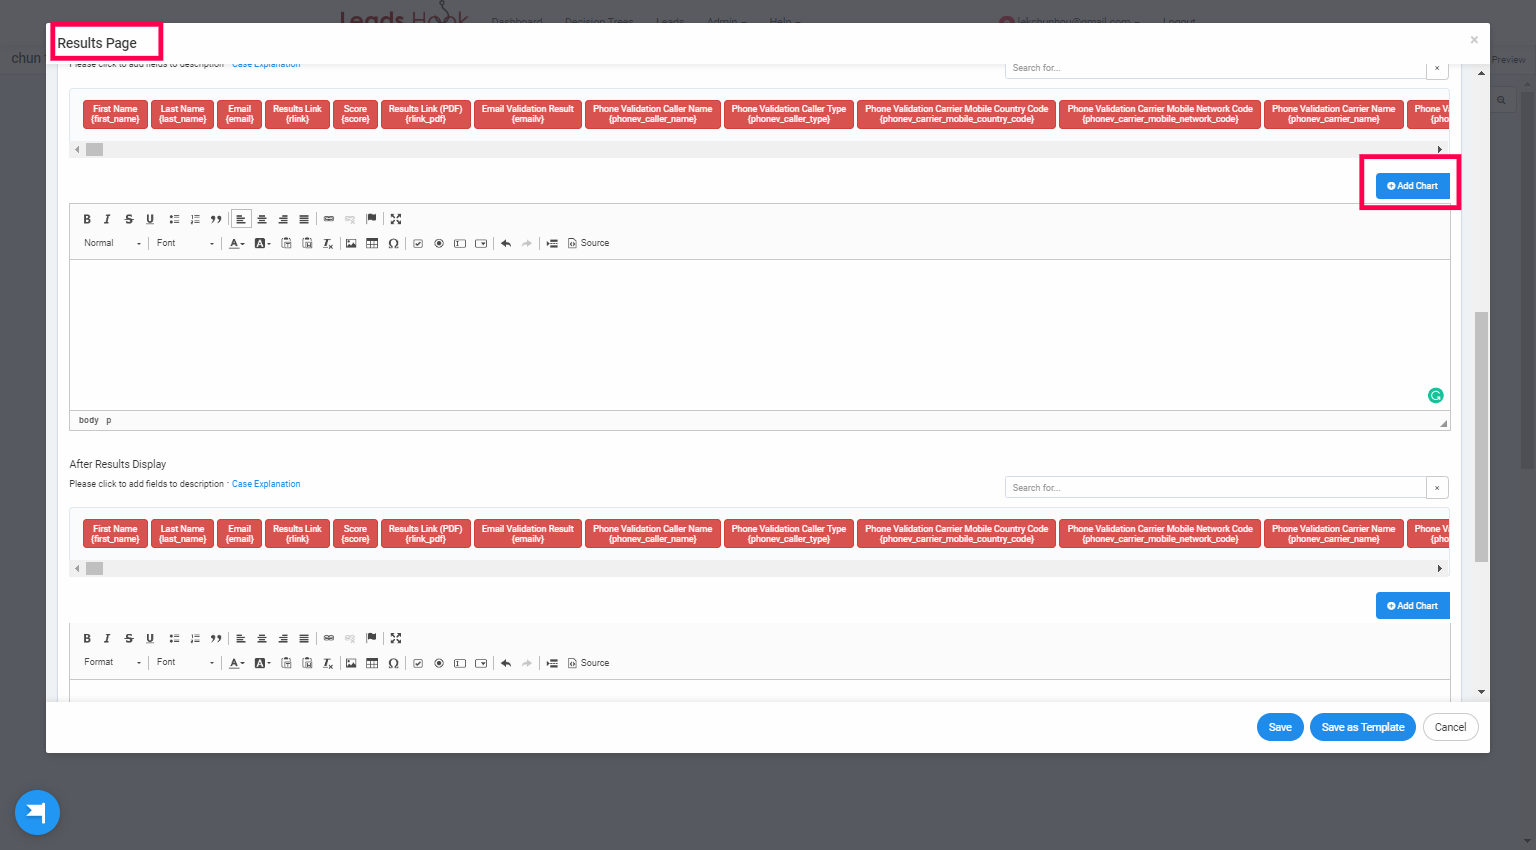
3. Add the Radar chart in your decision tree results page node
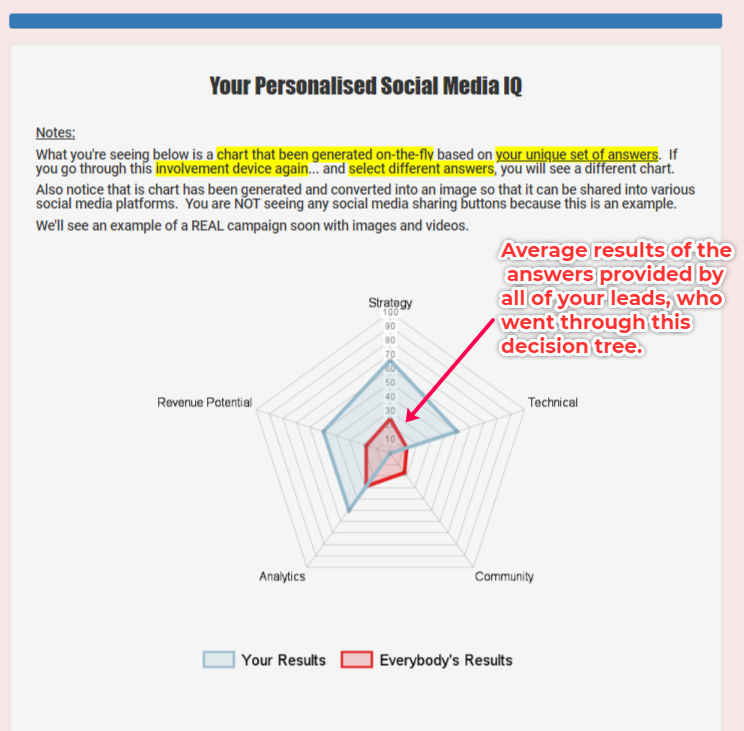
Conclusion:
Compiling all results into a single chart provides a clear and concise visual representation of your leads’ data. By following these steps, you can create such a chart in LeadsHook.
FAQs:
- Can I use different types of charts to represent data in LeadsHook?
- Yes, you can use a variety of chart types, such as pie charts, bar charts, and radar charts, depending on the nature of your data.
Related Articles
Why the entire chart area is colored?

